Chart Controls
Data Preview Bar
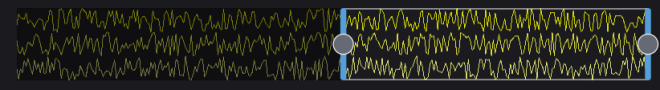
The Data Preview Bar gives a visual indication of the portion of the data that is currently displayed in the chart. The area in blue is the portion of the data that is currently displayed.
To pan left or right, use the mouse to drag the focus area. Panning stops the trace data stream. To resume, click  .
.
Display Controls

|
Zoom by region. Click and drag to select a region in the chart to zoom in. |

|
Zoom in. You may also use the scroll wheel on the mouse to zoom in and out. |

|
Zoom out. |

|
Auto scale the trace on both the x- and y-axis. |

|
Auto scale the trace on the y-axis. |

|
Auto scale the trace on the x-axis. |

|
Stop panning and resume trace data streaming in the chart. |